The new color chart is working out very well for me and my knitting speed for the border is back to normal. Here is a close up of the edging spread out- it should tighten up a bit more with blocking- but it's really neat to see how different the orange slub cotton manages this pattern from the white yarn in the knitting-and website sample.
Last night my DH asked me if "this thing was ever going to end" and if I was knitting "a circus tent" I think he is getting sick of me hauling around this orange pile with me where ever we go.
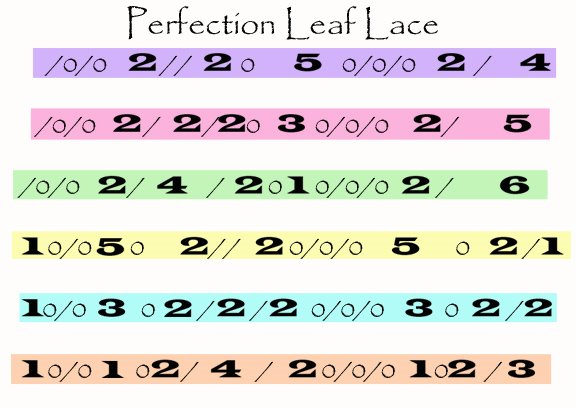
How I redid the chart in photoshop:
I opened the original black and white grid chart in photoshop and then made the canvas larger so I could stretch the chart vertically.
Then I opened up a new layer and laid some colored bars across the various pattern rows- by turning down the transparency of the entire layer it allowed me to see the original grid through the colors and for me to have pastel shades in the final image.
Then with the text tool in a new layer and a bold font- I wrote over all the spots where there were plain knit stitches. turning into a 6 sure makes things easier on my eyes.
Then I used a new layer of text, and a different font to mark all the k2tog and yo spots.
Finally I turned off the original grid and put in a white background. The End! Happy Chart.